Housing market outlook analysis worth taking seriously doesn’t come from YouTube thumbnails with houses on fire. I just wrote about why I don’t trust fear-driven crash videos. Then I came across something different.
Melody Wright is a housing analyst — not a YouTuber with a crash narrative to sell. She looks at mortgage data, delinquency rates, and regional inventory trends for a living. And her current housing market outlook is genuinely worth engaging with, even if I don’t agree with every conclusion.
Here’s what she’s seeing. And here’s how I’m thinking about it.
What’s Different About This Housing Market Outlook
The crash videos I criticized in my last post were making predictions based on vibes, fear, and speculative macro scenarios.
Wright’s housing market outlook is different. She’s pointing at specific, measurable, verifiable data points:
- The Freddie Mac House Price Index dropped from February to March at a rate not seen since 2011 — during what should be the spring buying season
- FHA 90-day delinquency rates are elevated and climbing
- Prime borrowers — not just FHA, not just subprime — are starting to show 30-day delinquencies at increasing rates
- Foreclosure filings are rising in markets that were previously stable
These are lagging indicators, not predictions. They’re telling us something has already changed — not something that might change.
The FHA Partial Claim Problem in the Current Housing Market Outlook
This one is specific enough to deserve its own section.
During and after the pandemic, the FHA used a program called “Partial Claim” to help delinquent borrowers. The FHA would advance money to bring a loan current, and the borrower would repay it later — interest-free, due when they sold or refinanced.
It was a pressure valve. It kept a lot of people from going into foreclosure who otherwise would have.
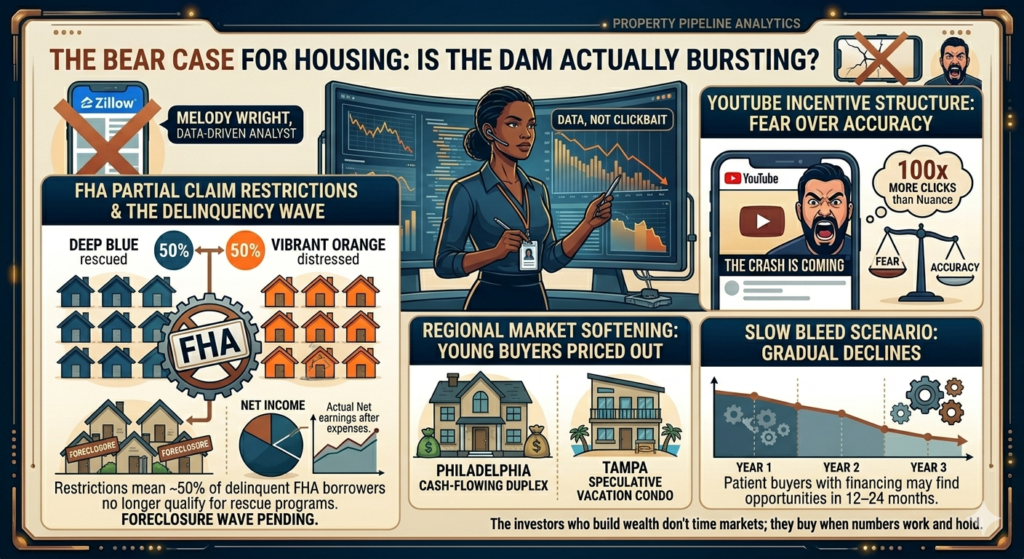
That pressure valve now has restrictions. There are limits on how often borrowers can access the program — roughly once every 18 months. According to Wright’s housing market outlook analysis, approximately 50% of currently delinquent FHA borrowers no longer qualify for the program.
Which means those borrowers are running out of options. Not all of them will foreclose — some will sell, some will find other solutions. But a meaningful percentage will end up in foreclosure proceedings. And that wave hasn’t fully hit the market yet.
The Regional Housing Market Outlook — Including Philadelphia
Here’s where the analysis gets locally relevant.
Wright identifies several regions where the inventory dam is already breaking:
Florida and Texas — Already well-documented. Inventory has surged, prices are correcting in many markets.
Midwest data center markets — Places like parts of Ohio and Indiana saw speculative buying driven by data center construction booms. Data centers create a lot of jobs during construction and almost none afterward. Inventory is now flooding those markets.
Northeast — including Philadelphia
Wright specifically identifies Philadelphia as a market where younger buyers are being priced out and leaving. As they leave, demand softens. As demand softens, the inventory that’s been building starts to matter more.
I’m not going to pretend this doesn’t give me pause. I live in Philadelphia. I’m studying the Philadelphia market. If younger buyers — the primary demand driver for entry-level and mid-tier housing — are leaving because they can’t afford to stay, that’s a real headwind for any optimistic housing market outlook here.
The “Slow Bleed” Scenario in Wright’s Housing Market Outlook
Wright’s prediction isn’t a sudden 2008-style collapse. It’s what she calls a “slow bleed” — a gradual multi-year decline rather than a sharp crash.
Her estimate: national home prices could fall 35% from peak over several years.
That’s a big number. I want to be careful about how I engage with it.
On one hand, a 35% decline from peak would be historically significant — larger than the correction in most non-2008 downturns. It would require sustained pressure from multiple directions simultaneously: rising foreclosures, softening demand, elevated rates, and continued affordability stress.
On the other hand, the conditions for that kind of housing market outlook aren’t impossible. If the FHA delinquency wave does materialize, if prime borrowers continue to weaken, if the lock-in effect starts to crack as people are forced to sell regardless of their rate — the supply situation could shift faster than the optimistic case assumes.
Where I Land After Both Housing Market Outlook Analyses
After the crash YouTube content and then Wright’s data-driven analysis, here’s where I actually sit:
The optimistic case: The lock-in effect suppresses supply, lending standards are tighter than 2008, and we get a soft landing with regional variation rather than a national collapse.
The bear case: The FHA delinquency wave is real and hasn’t fully materialized yet, prime borrowers are starting to crack, and the slow bleed scenario plays out over several years.
My honest read: Both contain truth. The market is almost certainly more vulnerable than the “no crash ever” crowd claims and more resilient than the “35% collapse imminent” crowd claims. The housing market outlook depends heavily on what happens with employment.
According to Census.gov, regional housing market variation has been extreme in the 2022–2025 period — with some markets already seeing 15–20% price declines from peak while others remain near all-time highs, confirming that any single national housing market outlook misses the most important dynamics.
What This Housing Market Outlook Means for Someone Like Me
I’m in the research and preparation phase. Not actively buying yet.
And honestly, this analysis makes me more comfortable with that timeline — not because I’m scared of the market, but because if Wright’s slow bleed scenario plays out, patient buyers who have their financing ready and their criteria clear will have better opportunities in 12–24 months than they do today.
The worst time to buy is when everyone is euphoric and inventory is nonexistent. The best time is when there’s fear in the market and motivated sellers need to move.
We might be moving toward the second condition. Slowly. Over time. I’d rather be ready for that moment than rushing in before it arrives.
Use the Philadelphia Deal Finder to track actual inventory and motivated seller activity in your target Philadelphia neighborhoods — real local data matters far more than any national housing market outlook.
Not financial advice — just someone doing a lot of research and asking a lot of questions. Market analysis is inherently uncertain — don’t make major financial decisions based on any single analyst’s predictions, including mine.